AppreciHome
Your Ad-Free Home Value Tracker
Your Ad-Free Home Value Tracker
Government-tracked appreciation data for every U.S. state and metro area. Updated every quarter. Beautiful charts on any device.


What is AppreciHome?
AppreciHome lets anyone track real estate appreciation for any U.S. state or metro area — right from your phone or tablet.
Other apps and websites use speculative algorithms and market sentiment. AppreciHome uses verified, quarterly government data and indices directly from the Federal Housing Finance Agency (FHFA), to give you objective, accurate results. Unlike other appreciation estimates that rely on average sale prices (which can be skewed by new construction or a different mix of homes selling), the FHFA uses a repeat-sales methodology — tracking the same homes over time — to produce the most accurate measure of true home appreciation available.
That means the data that AppreciHome uses is extremely accurate and allows you to stay informed as the information automatically updates!
What Can You Do With It?
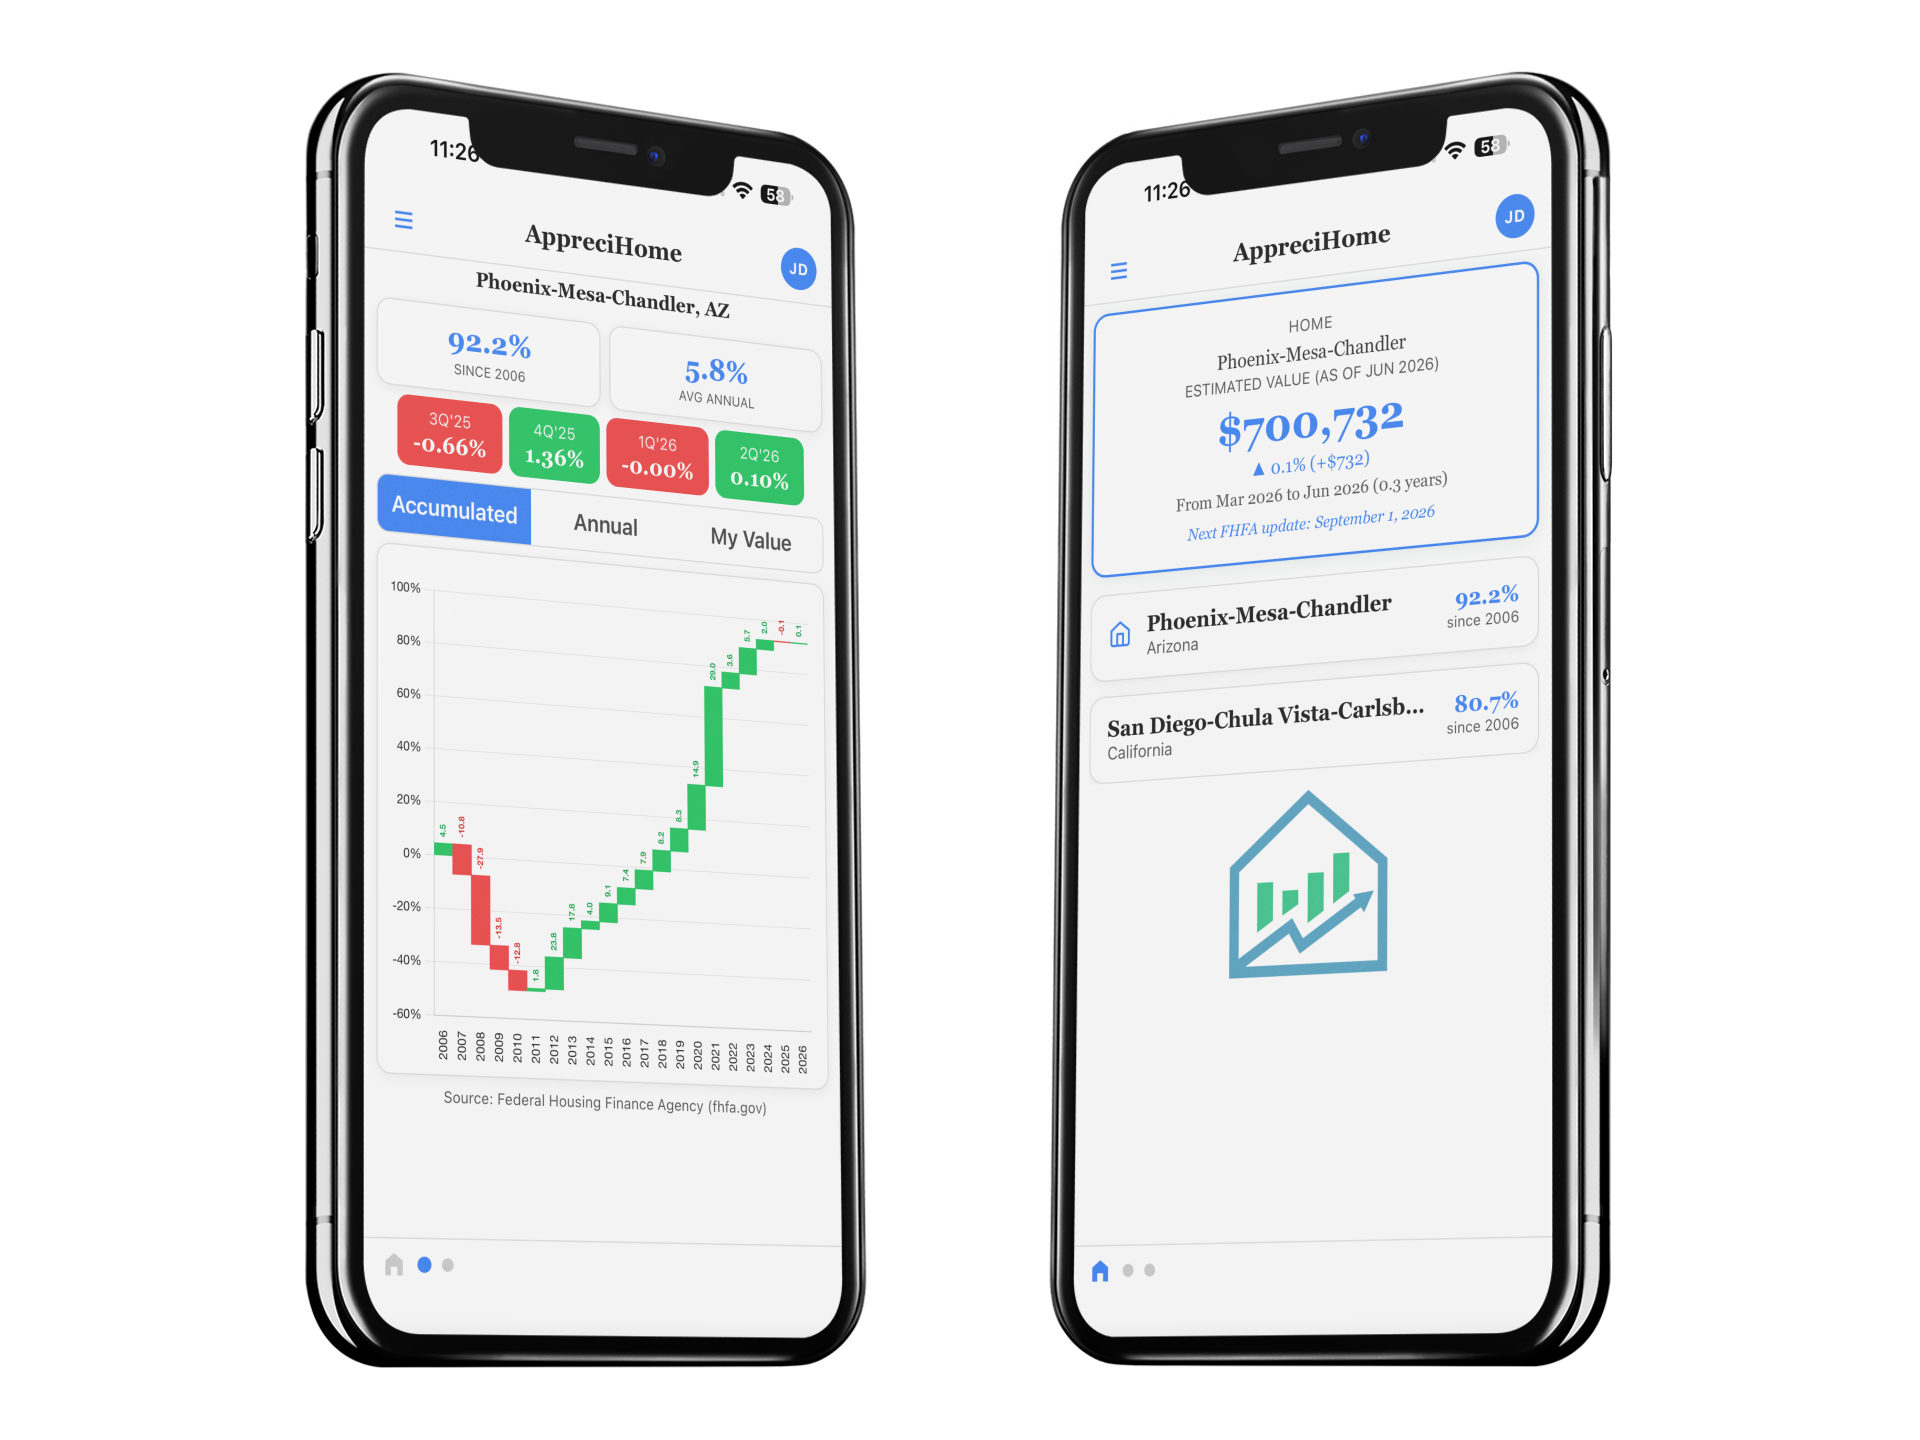
See decades of compounding appreciation in a single chart. Understand how home values have built over time.
Year-by-year appreciation rates going back decades. Spot cycles, downturns, and recovery patterns.
Swipe between saved locations like a weather app. Add it to your home screen for instant access.
Explore home values in metros across every state. Bookmark the areas you care about most.
Government-tracked data updated every quarter. Stay current on where the market is heading.
Enter your purchase date and price to see your own home's appreciation — personalized just for you.
Data sourced directly from the Federal Housing Finance Agency

Many apps share or sell your data and usage information to outside brokers or other companies. This means that you sign up for one service and end up getting calls from another company attempting to close you on something.
AppreciHome is different! We will never sell your information, your data stays yours. We want this app to be a great value that allows you to track your home's worth without a bunch of spam or additional sales contacts.
Watch this quick walkthrough of AppreciHome so you can see how easy it is to setup and use the app to know your worth.
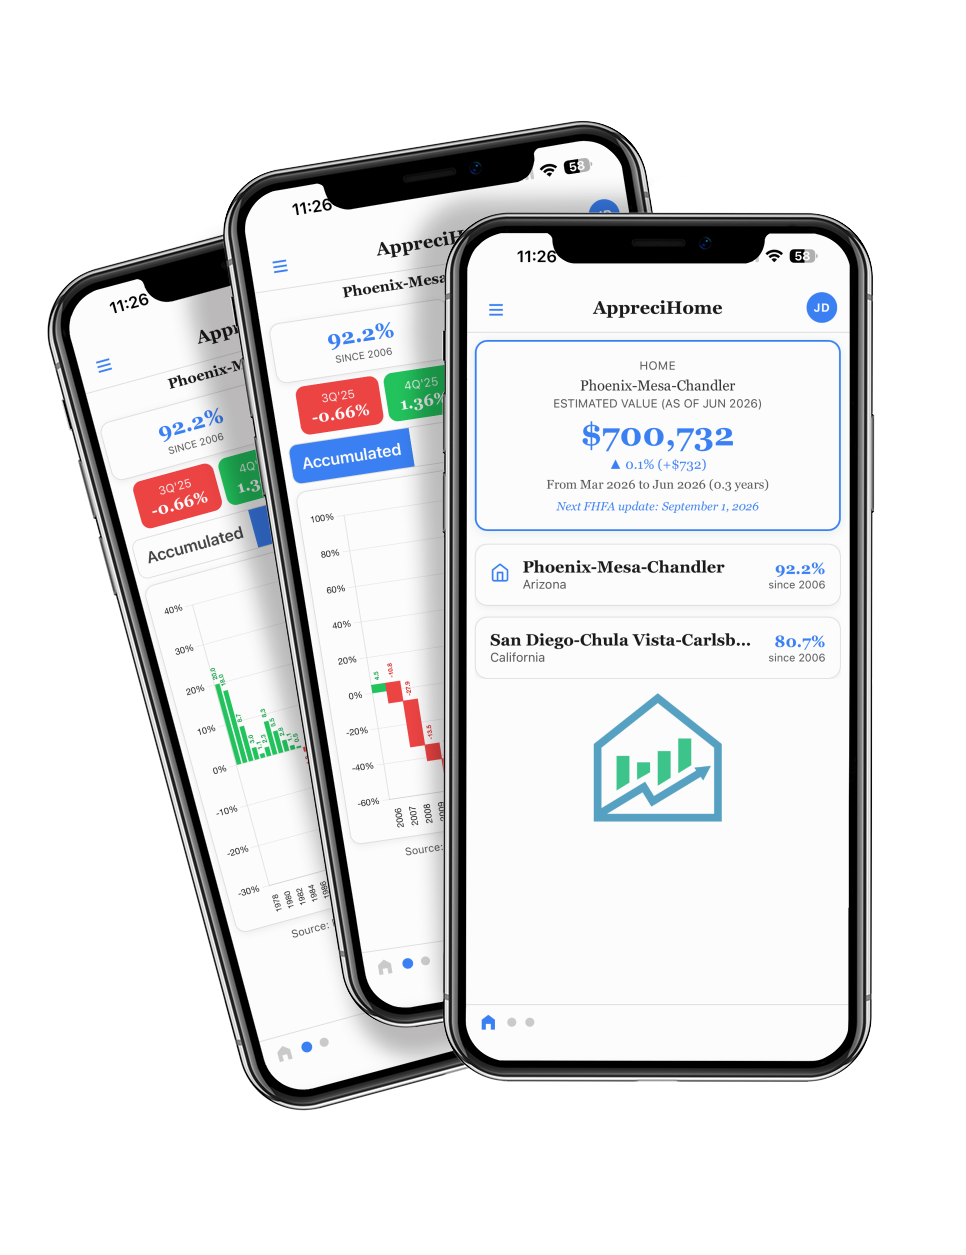
Tracking your home's value has never been easier or more accurate. Once you download the app and sign up you'll be prompted to add your home purchase details (Price, Location, Year, and Quarter) then you can put your mind on auto-pilot to stay informed.
Tim DeLeon a former HP Engineer started selling real estate and found that there was so much data available that wasn't being used to truly answer pricing questions. He built a software for real estate agents and has taught around the nation helping elevate home valuation and pioneering terms such as the Competitive Market Analysis and Pricing Strategy. After years of only sharing these graphs and information among real estate professionals, Tim wanted to help homeowners stay informed and make it easy to track the value of what for most will be the single greatest investment in their lives.
For over 10 years Tim has used the Federal Housing and Finance Administration (FHFA) data to create clear and easy to understand graphs that agents have used to connect with clients and inform their network. The simplicity and accuracy of this automatically updated data (quarterly) has been a game changer for Realtors across the US. When Tim looked at how he could help the consumer he knew this graph was the way. These graphs, while simple, are so powerful he has had companies try and buy them exclusively throughout the years. Now you have access to them!
The AppreciHome app is the answer to the question, "How can we help homeowners know their value, and watch it change over time, without needing to master real estate pricing techniques and processes?"
The app is extremely easy to use and to get going. It uses the government's House Pricing Index (HPI) to track your home's worth and the Federal Housing and Finance Administration (FHFA) data to watch wide area value change. All you need to do in order to track your value is search for your area, add your home purchase information and click save. Then you'll be automatically updated as new data is released!
Yes! If you're in the US. AppreciHome uses government data from the Federal Housing and Finance Administration (FHFA) that covers all of the US using areas they call Metropolitan Statistical Areas (MSA) and their House Pricing Index (HPI) to track home values over time. Their coverage includes all of the 50 US States.
The MSAs are divided using government bounds, so your individual city may be grouped with others or included in a larger metro area, so you may need to reason through the available MSA options to find the closest to your home.
AppreciHome costs $9.99 per year billed once every twelve months from the starting date.
Note: We are constantly adding more features, value and connection to this subscription. Prices may change over time.
Automated Valuation Models (AVMs) are often wrong for many reasons. This can be due to issues with their price-per-square-foot methods, new home sales skew of appreciation, or incomplete information. Online portals use speculative algorithms and market sentiment. AppreciHome utilizes verified, quarterly government data that tracks the same homes over time — giving you the most accurate measure of true home appreciation available.
Yes! If you're having issues with the app, reaching out using the support link to contact our team is the easiest way to get help. We are also available at support@apprecihome.com.
If you're ready to take control over knowing the value of your home, giving yourself peace of mind, confidence in your investment and never miss out on opportunities to leverage your worth, click below and download AppreciHome!